Content repurposing statistics for 2026 (honest data, no AI BS)
Content repurposing statistics for 2026: what primary sources verify, what operator audits show, and what no one can confirm yet.
Last verified · 2026-10-23 · by Moe Ameen
Published 2026-05-22 · Updated
Short answer
Few content repurposing statistics survive a source check. Of the ones that do, YouTube says half of all channels and videos have an impressions click-through rate between 2% and 10%, and Mailchimp puts the average email open rate across industries at 35.63%, from data last updated in December 2023. Most "repurposing boosts engagement by X%" figures trace back to vendor blogs with no published method.
Key takeaways
- YouTube: half of channels and videos have an impressions CTR of 2-10%.
- Mailchimp: 35.63% average open rate across industries (data last updated December 2023).
- No primary source we found gives a defensible multiplier for repurposing reach.
- Treat any statistic you cannot trace to a published method as marketing copy.
Most content repurposing statistics floating around the internet trace back to one of three suspect sources: AI-generated listicle content with fabricated specifics, vendor-funded studies with selection bias, or old surveys re-circulated as current data. We would rather give you a short list of numbers we can source than a long list we cannot.
What is below is what we could verify against a primary source, the planning assumptions we use where no data exists, and what we explicitly do not know. Every primary source we used is listed at the bottom of this page.
What do primary sources actually report about repurposing?
A small number of large content marketing surveys publish each year — the Content Marketing Institute annual report, HubSpot State of Marketing, Sprout Social Index, Litmus State of Email. They cover content marketing broadly rather than measuring repurposing on its own. Treat any repurposing figure from them as a directional signal, and read the methodology before you cite it.
Platform-level data from TikTok's Creator Marketplace, YouTube Creator Insider, Meta Business reports, and LinkedIn Marketing reports provides engagement benchmarks but does not directly measure repurposing impact vs single-platform publishing. The cleanest framing is to use platform-published average engagement rates as a baseline and compare your operation's engagement against the baseline — not to cite specific repurposing ROI numbers.
What do we plan around when there is no hard data?
Where no primary data exists, we plan with working assumptions. These are planning targets, not measured results, and they will not fit every operation.
- Source-to-output ratio: we plan for 25-40 derivative outputs per hour of long-form video, 15-25 per hour of audio, and 8-15 per text source before quality drops.
- Content lifetime: we assume short clips and social posts get most of their attention early, while a blog post that ranks can keep earning search traffic for much longer.
- Reach: one source published across several platforms reaches people who only use one of them. We have no defensible multiplier for that, and neither does anyone who quotes one without a method.
Treat these as starting assumptions. Replace them with your own numbers after a quarter of tracking.
Which repurposing statistics should you ignore?
Ignore any "repurposing increases engagement by X%" figure you cannot trace to a published method. Many of them come from vendor blog posts that link to other vendor blog posts, so the original methodology is impossible to check, and we will not cite them as facts.
Specific timing claims ("posting at 9am beats posting at 3pm") deserve the same suspicion. The right posting window depends on your audience, and generic "best time to post" charts rarely show how they were built.
Which baseline numbers can you actually verify?
Two baselines that matter for repurposing come straight from the platforms that measure them:
- YouTube impressions click-through rate: YouTube's own help center says half of all channels and videos have an impressions CTR between 2% and 10%.
- Email open rate: Mailchimp's benchmark page puts the average open rate across all industries at 35.63%, from data last updated in December 2023 and limited to campaigns sent to at least 1,000 subscribers.
These are baselines, not targets. A repurposing operation that beats baseline on 1-2 platforms is performing well; one that beats baseline on 5+ platforms is exceptional.
What does this look like in Kompozy?
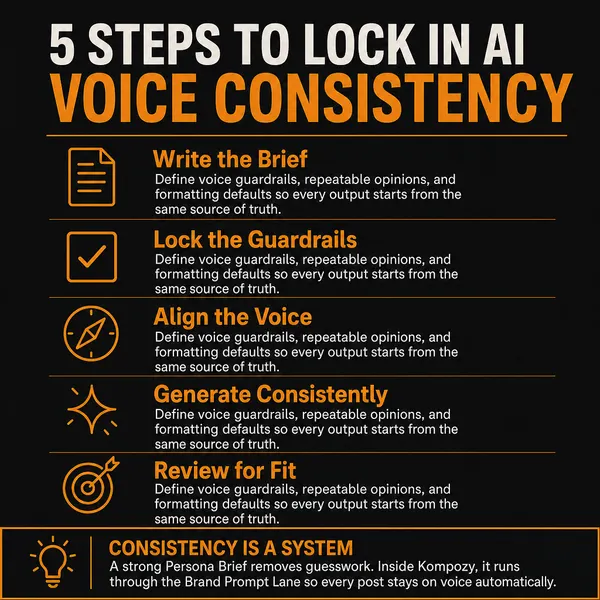
A real output from the Kompozy workspace in the infographic photo post format, one of the outputs this workflow calls for. It shows the format, not a piece made from this page's example.
Who is this for, and who should skip it?
Best for:
- Creators and marketers who want baselines they can cite with a source.
- Anyone checking a repurposing statistic before putting it in a deck or a post.
- Operators setting up their own tracking instead of borrowing industry averages.
Not ideal for:
- Readers who want a long list of headline percentages; we kept only what we could source.
- Anyone looking for repurposing ROI benchmarks; nobody publishes a defensible one yet.
Frequently asked questions
Why are there so few specific repurposing statistics?
Because the cross-platform attribution problem is hard. Most platforms do not share enough data for clean repurposing-impact studies, and most operator data is anecdotal. The honest answer is "we know directional patterns, not specific numbers."
Which repurposing statistic should you trust least?
Any single percentage for how much time repurposing "saves." Time saved depends on the workflow you had before, so one figure cannot be true for everyone.
Are platform-published engagement rates reliable?
Reasonably so. They aggregate across large account samples. Use them as baselines, not as predictions for your specific account.
How do I measure repurposing ROI for my own operation?
Track unique audience reach across all platforms relative to source-piece production time. The ratio matters more than absolute numbers — improvement quarter over quarter signals the operation is working.
What about AI-generated statistics in the listicle pages?
Most are fabricated. If a statistic is cited without a source URL you can verify, treat it as fiction. The 2026 information environment is hostile to specific numerical claims.
Do statistics from 2022-2023 still apply?
Engagement-rate trends do; specific algorithm impact numbers do not. Platforms have changed algorithms enough that 3-year-old specifics are noise.
What is the one statistic you most wish creators understood?
Content lifetime varies a lot across platforms. A social post gets most of its attention early, while a blog post that ranks can earn search traffic for years, so split your effort across buckets with that in mind.
How do we know this?
We checked every figure on this page against the sources listed below on 2026-10-23 and removed every number we could not trace to a primary source. The planning ranges on this page are labeled as our assumptions, not measured results.
Sources
- YouTube Help — Impressions & click-through-rate FAQs (read 2026-10-23)
- Mailchimp — Email Marketing Benchmarks and Metrics Businesses Should Track (read 2026-10-23)
- Kompozy — Pricing (read 2026-10-23)